
This content was originally written and published by the HAVEN Metrology team on their website. Reproduced here from http://www.havenmetrology.com/combining-scanning-systems-for-increased-capability/
One of the significant limitations of industrial CT scanning is measurement volume. We’ve received several projects that are larger than our Nikon XTH 225 ST’s effective volume. This isn’t a problem if our clients want to focus on a specific area of their part, but if they need to analyze the entirety of a large part we need to get creative.
When scanning these larger parts there are two major variables we need to consider:
- Additional noise due to increased, variable linear densities
- Increased quantity of scans to limit the introduction of various types of artifacts
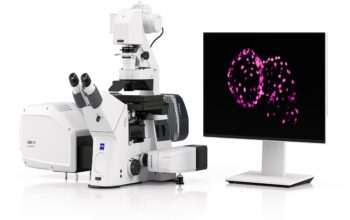
With the introduction of such variables our best control is to use our Zeiss Comet L3D 3d scanners as “controls.” These extremely accurate scanners will assist in the alignment of the CT scans.
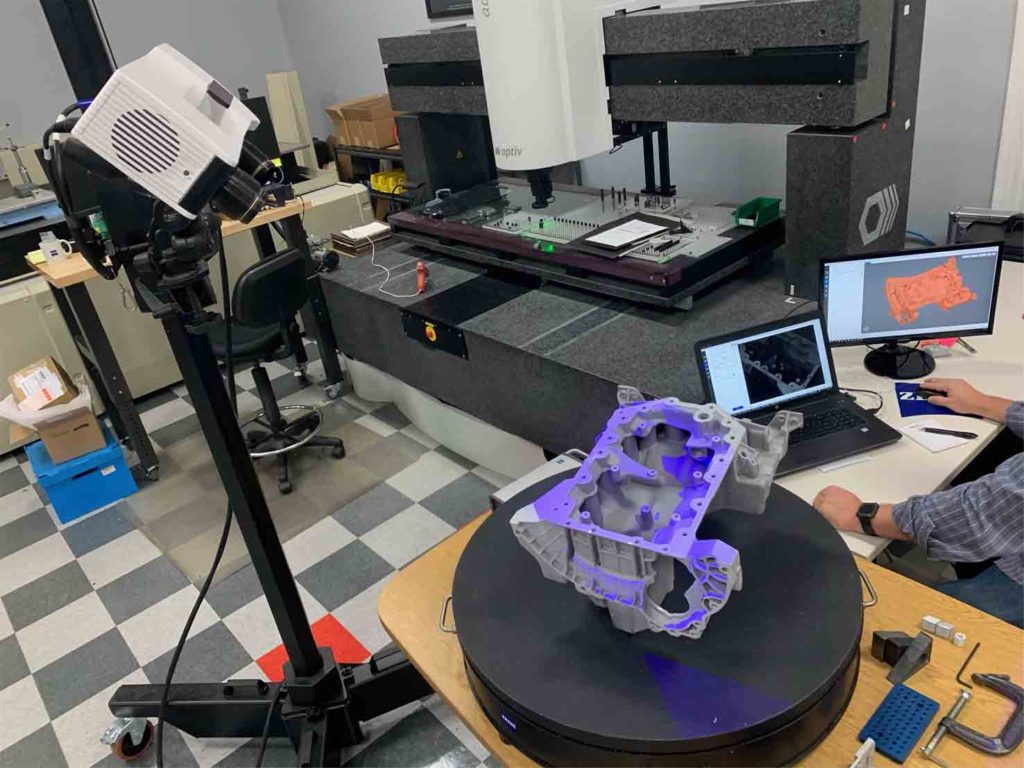
Zeiss Comet L3D Scanner – We scanned this casting to lay the foundation for aligning CT scans
CT Scanning Large Samples
For the our first full porosity analysis of this scan we used 12 total CT scans. The second only required 10 because we had refined the process. Due to variance in linear densities between different scanning areas, it is important to optimize settings across the different softwares so that observable data is consistent.
For our initial R&D project for this client we aligned the individual CT scans back to CAD. The issue with this is that large, raw castings typically have a lot of extra stock in non-machined areas. The result is that individual scans did not align very well to each other. By aligning CT scans back to a surface scan that extra stock is common and increases alignment accuracy.
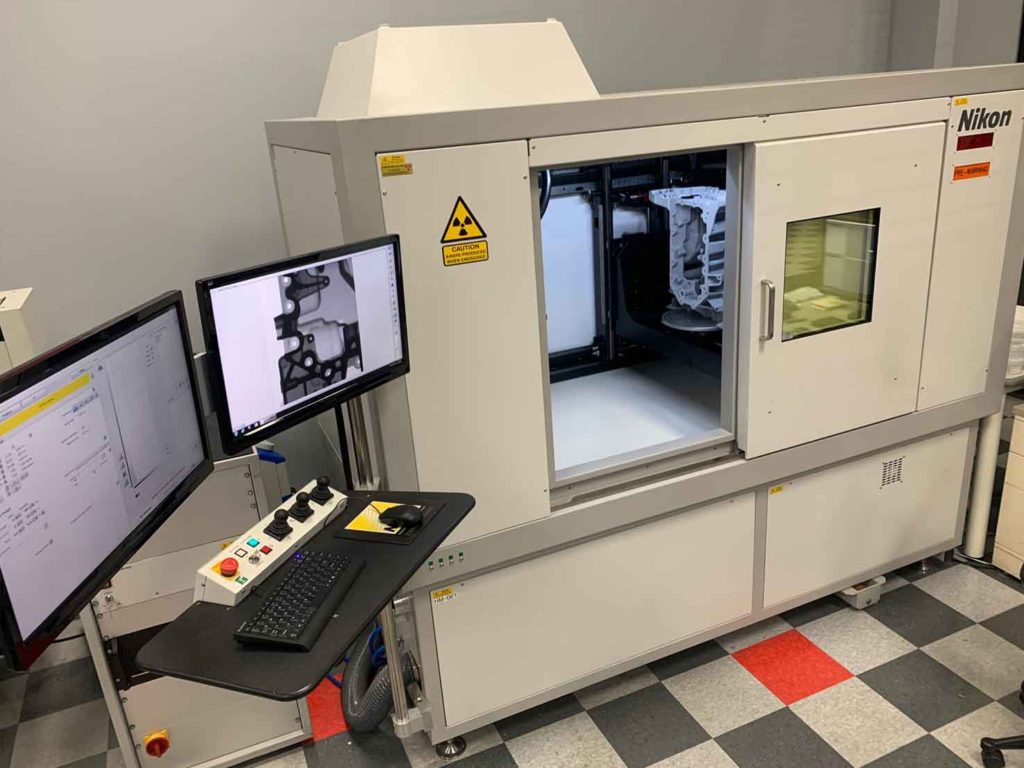
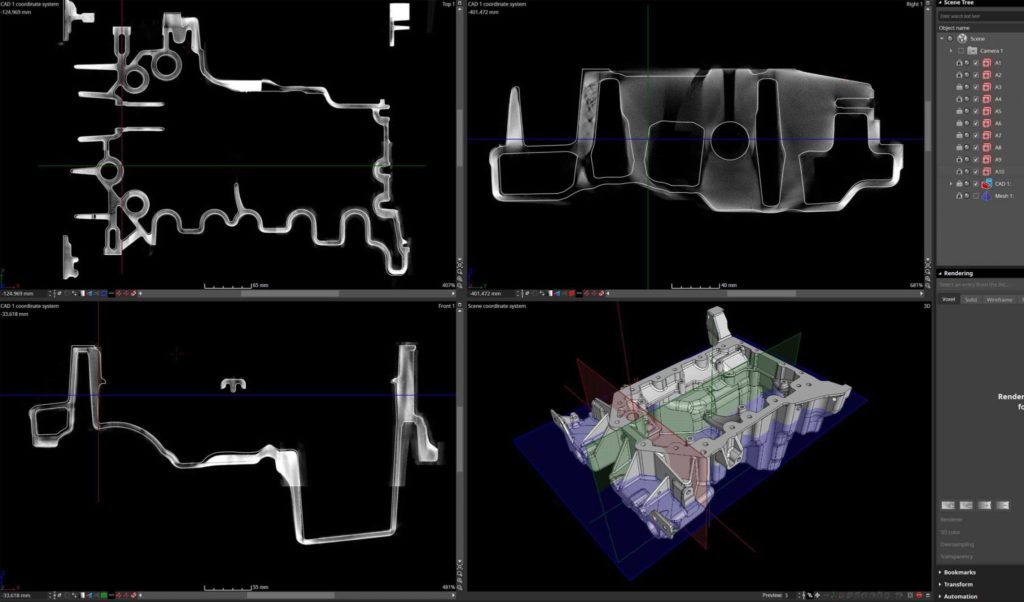
Casting in CT System – The radiography image to the left shows the largest volume we can achieve for each scan
Fitting Scans and Analyzing Slice Data
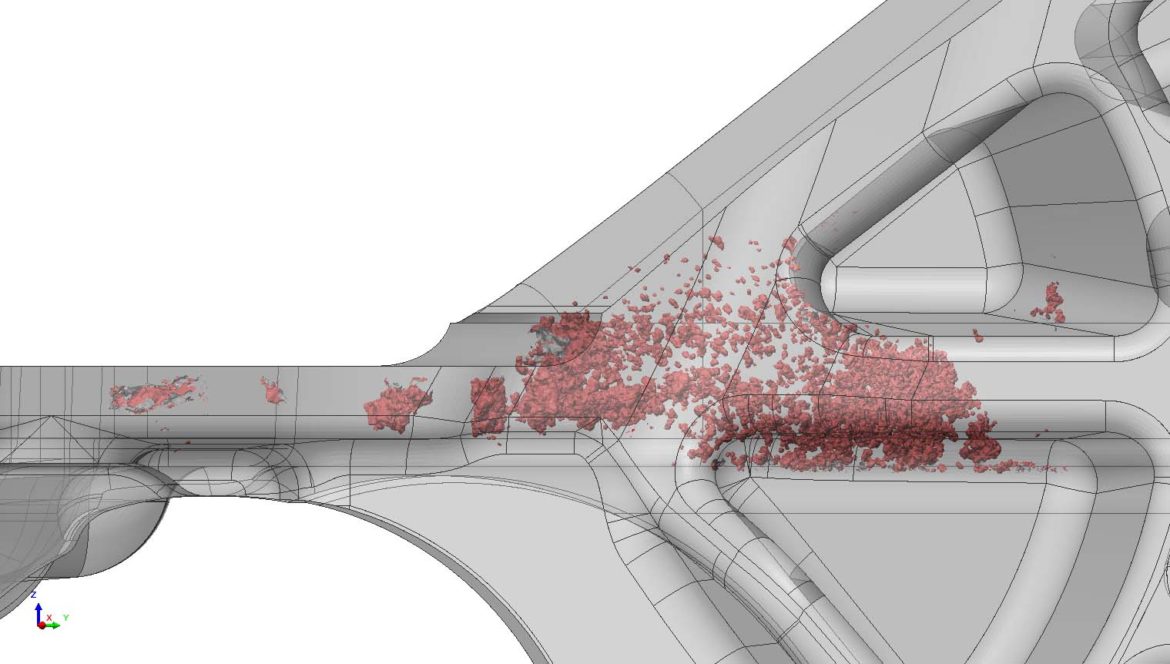
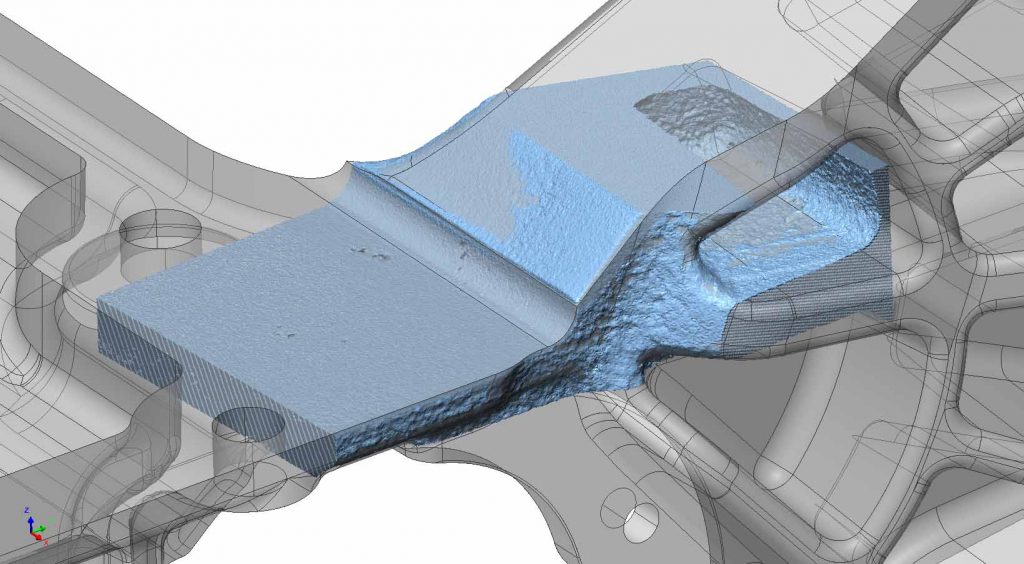
Below is a demonstration of slice data after merging ten CT scans. Each of these was best fit to the surface scan; the surface scan was best fit to the CAD model. This allows us to see exact locations of porosity and inclusions back to a general best fit of the part.
Even after optimizing settings across all software’s there is a large range in our gray values. However, these thresholds can be manually adjusted for further analysis.
Focus Scanning
Our client was experiencing cracking in a specific area. We were able to provide a focus scan by increasing the proximity of the sample to the x-ray source. This provided much higher scan resolution with less noise. The area in question was filled with pores. This scan was also fit back to the surface scan to get accurate profile measurements.
What We Learned
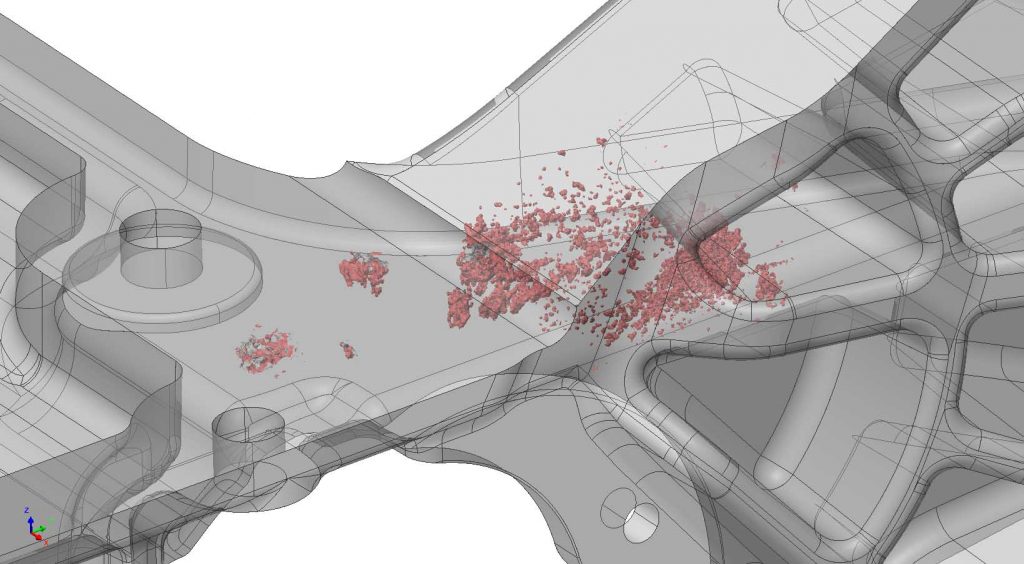
We were able to provide a full map of porosity and profile heat map of the part. Our summary report suggested that cracking was being caused by two factors:
- Heavy porosity in the regions of interest
- Material was light by nearly a millimetre in the same regions of interest
Video of Porosity
Important time stamps for this video are:
- 0:10 seconds shows porosity in the upper right corner. This is the area of interest demonstrated in this post
- 1:15 shows porosity on near the primary datum
- 2:04 shows several large clusters
Blue outlines are CAD. Red outlines are the surface scan.
For more information, please check out http://www.havenmetrology.com/