
Inevitably, the physical output of any CAD-based manufacturing process will differ from the input model. That is true for any
manufacturing process, whether it’s machining, molding, stamping, casting, forging, or 3D printing. Deviation from the CAD
model may be minimal, but it is there! Sometimes that’s acceptable, sometimes it’s not. It is the role of the manufacturing
engineer to find the optimal solution that meet Time, Cost, and Quality requirements.
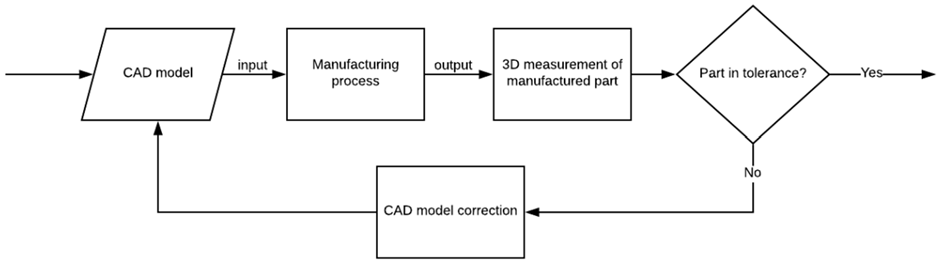
With industry 4.0, closed-loop manufacturing becomes crucial in providing a competitive advantage to manufacturers, helping
them get the most of their manufacturing processes. Using the latest 3D measurement technology, it’s now easier than ever
to quickly get accurate dimensional information on manufactured parts. The challenge is to be able to feed that information
back (upstream) into the manufacturing process to make corrections and “close” the manufacturing loop.
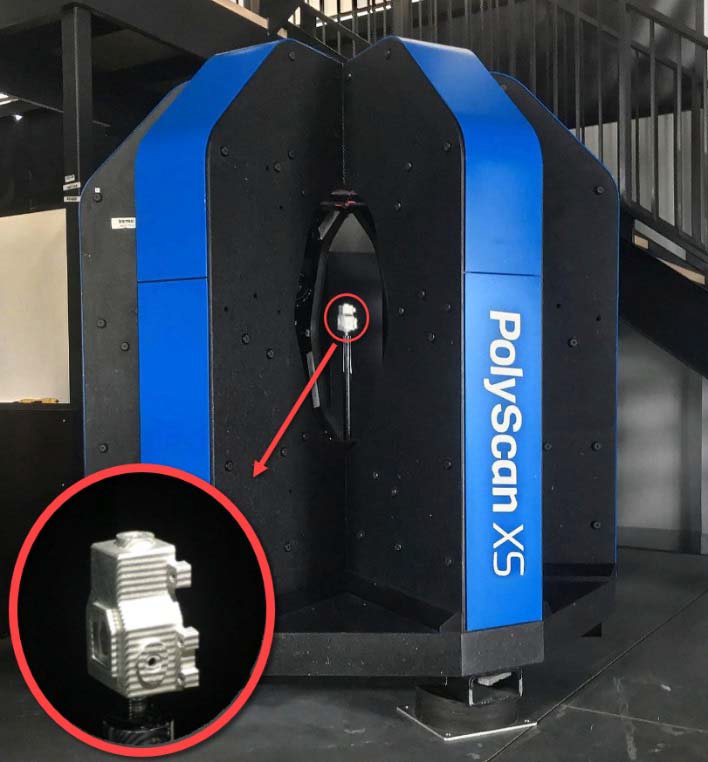
In this paper, we will show how dimensional information acquired from 3D scanning a metal printed part can help us correct
the input CAD model to get a significantly more accurate output part in a single iteration. The part we printed comes from NIST
MBE-PMI Validation Model Library (CTC-02)1. A first sample was printed and measured using a high-accuracy PolyScan XS Surround 3D Scanner.
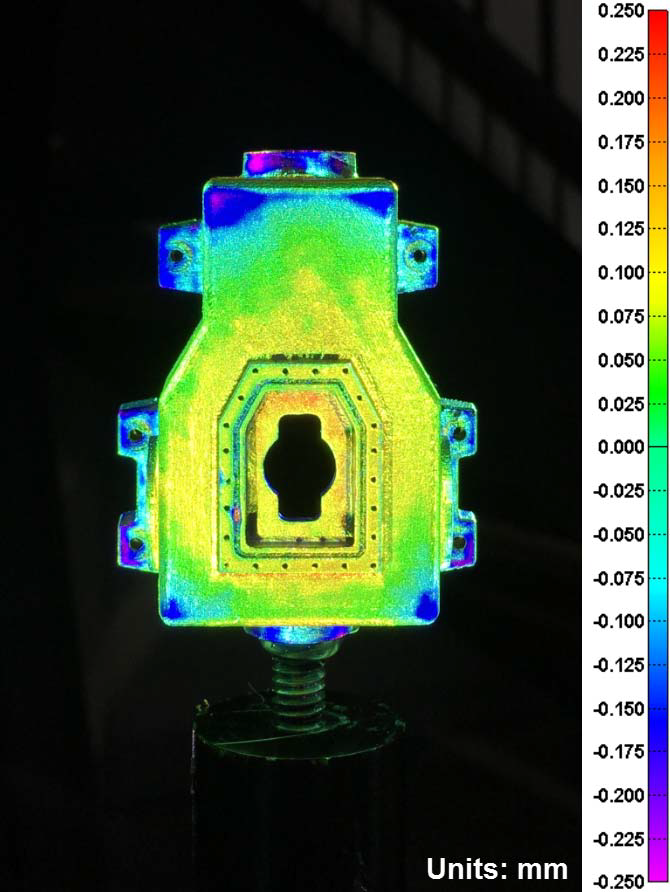
Comparison between the output scan data and original CAD input reveals surface deviation induced by the 3D printing process.
Those deviations are in the range of 0.250mm and can be displayed on the physical part using Polyrix’s LiveInspection deviation
projection.
After quantifying surface deviations induced by our 3D-printing process on a single part, and before making any adjustments,
we need to make sure this deviation pattern is consistent on many parts. To confirm that, we scanned five (5) samples coming
from that same 3D-printer. We then ran a combined analysis of those samples in PolyWorks|Inspector (by InnovMetric)3, using
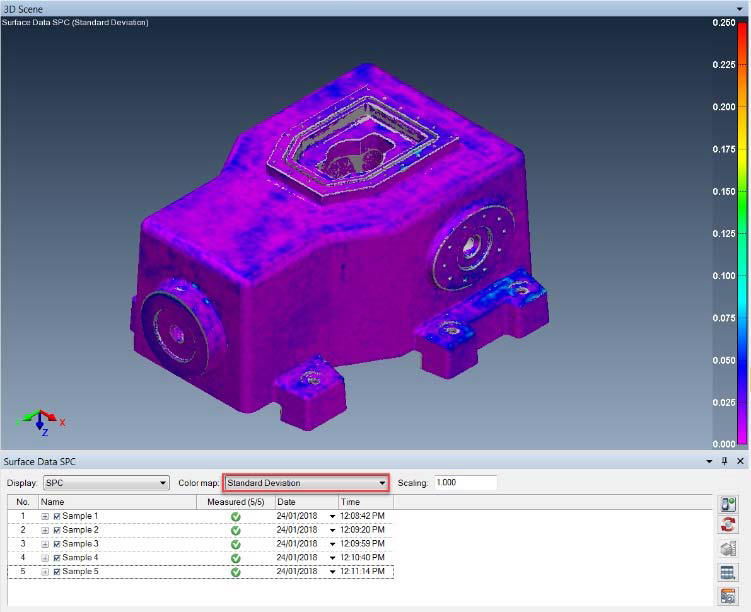
the Surface Data SPC tool, and obtained an average deviation colormap and a standard deviation colormap
After quantifying surface deviations induced by our 3D-printing process on a single part, and before making any adjustments, we need to make sure this deviation pattern is consistent on many parts. To confirm that, we scanned five (5) samples coming from that same 3D-printer. We then ran a combined analysis of those samples in PolyWorks|Inspector (by InnovMetric), using the Surface Data SPC tool, and obtained an average deviation colormap and a standard deviation colormap.


deviation colormaps.
As we can see, the average deviation colormap (left) show a similar pattern to the first sample shown above. The standard deviation colormap (right) tells us that our 3D-printing process consistently induce deviation in the same areas of the part.
In the attempt of getting a 3D-printed part closer to the desired CAD, we used a technique called morphing to correct the CAD model. Simply put, we moved the CAD model surface up where the physical part was too low, and vice-versa. This morphed model of the CAD was generated using the Polyview Software (by Polyrix), using the original CAD and 3D deviation information output by the PolyScan XS.
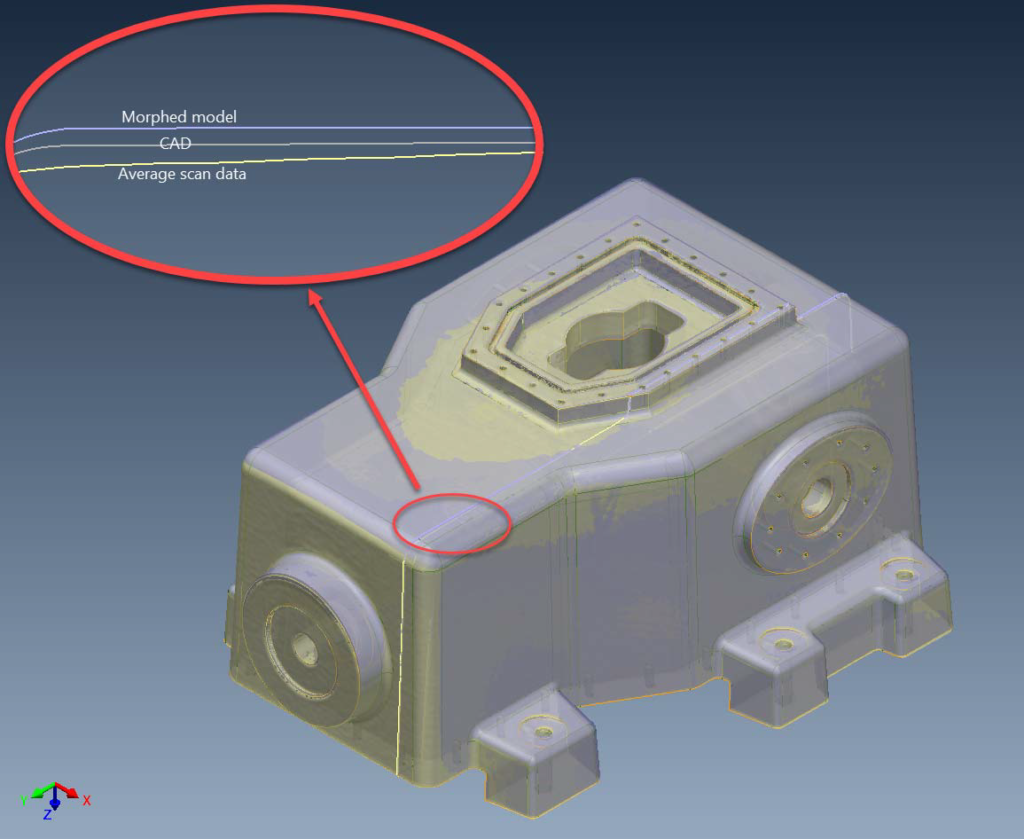
(purple). A 2D section cut allows us to get a better understanding on how morphing was applied.
This corrected (morphed) CAD model was then sent back for 3D printing. The resulting 3D printed part was then scanned and compared to the original (desired) CAD model. As we can see, deviation in most areas are now under 0.050-0.075mm, so 4-5 times smaller than measured on the original printed part.
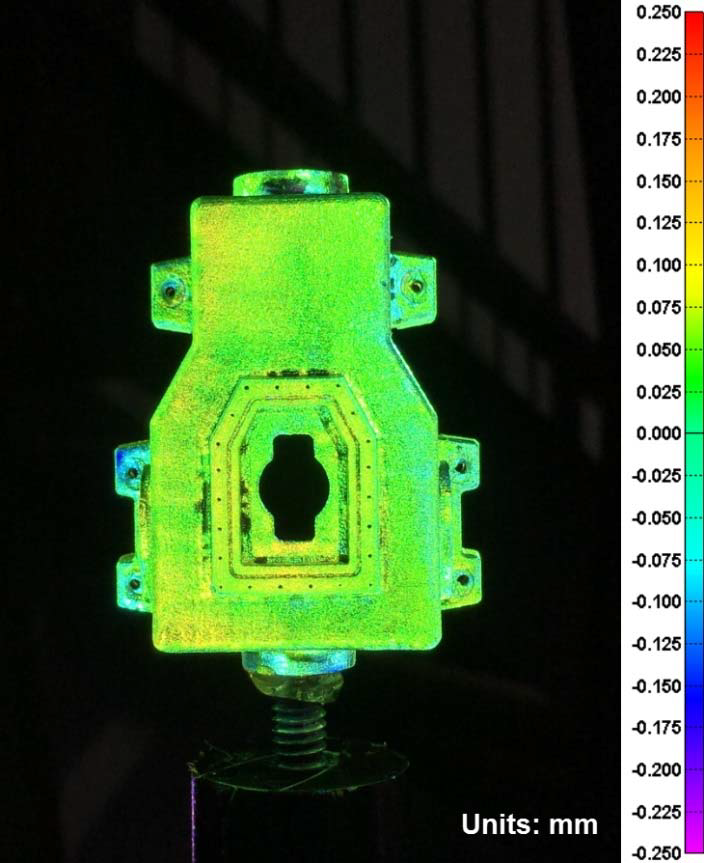
see the improvement, when comparing to Figure 3.
In conclusion, we demonstrated how we can significantly improve the output of our 3D printing process in a single iteration, using information from 3D scanning to correct the input CAD model. Of course, it is possible to fully automate such a closed loop process by using the proper material handling equipment, and/or in-situ measurement when possible. The data exchange & processing is also crucial, so a good communication network is required between manufacturing, inspection and computing devices involved in such closed-loop manufacturing processes.
The role of a 3D measurement system should go beyond simply telling if a part is good or not, it should provide corrective information to get the most from a manufacturing process. For more info, or a demonstration, please contact Polyrix at www.polyrix.com/contact/ .