
If ever there was a time where Americans of all stripes were receiving a crash course in the challenges of being a statistician or a numerical models expert, it is now. As the novel coronavirus (COVID-19) spreads its way deeper in the country’s rural interior (potentially disrupting our food supply), more and more of us have become familiar with terms like V-curves, and U-curves, and of course, the made-for social media hashtag, “flatten the curve.”
Through daily updates across a variety of outlets, whether Americans realize it or not, they have become accustomed to something metrologists (measurement professionals) know all too well: the challenges of data variability.
Think about it. In March 2020, worse-case scenarios predicted that over a million Americans could die before the global pandemic ends. Several weeks later, newer modeling cut that figure to between 100,000-200,000. And, just as the cherry blossoms bloomed in New York’s Central Park, yet another potential death toll was calculated, this time closer to 50,000. Today the projected death toll by August is 135,000, subject to ongoing updates. For policymakers, healthcare professionals, and average citizens, the uncertainty can feel maddening.
But it’s important to remember the reason for this uncertainty: a lack of quality data.
Model outcomes, like gage analyses, are only as accurate as the data fed into them. The expression may be “you can’t manage what you don’t measure.” But for metrologists, it would be more precise to say, “You can’t manage what you don’t measure accurately.”
Metrology’s Magic Moment
From a metrology perspective, these challenges in data quality resonate. They resonate because, in the science of precision measurement, accurate inset data is also key. Otherwise, like the ever-shifting COVID-19 mortality models, the variation, or extremes of possible values, becomes too great to offer any value. Likewise, the variance in a gaged device must be narrow enough and the granularity of information collected deep enough to ensure that what’s being measured is correct.
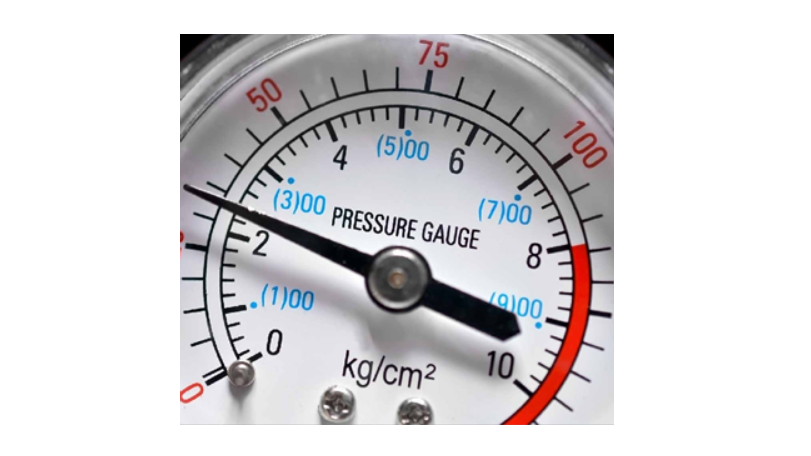
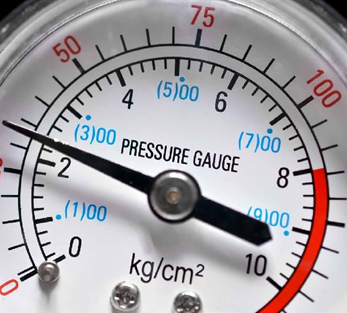
Rarely do consumers consider this a basic measurement need? Whether it’s a digital or analog gas gage on a car or boat, or it’s an arm cuff blood pressure monitor, or it’s the accuracy of a micrometer or caliper, or any of a host of other instruments, the reliability of that readout depends on how rigorously it’s been evaluated. For metrologists, this is their “true gage” of success. Here, too, like with COVID19, mass testing is critical for accurate results.
Managing “Mayhem” Through Precision Measurement
But what does all this mean for metrology? What does it mean when the economy reopens and there’s a flood of demand? Imagine new car sales, new housing, new commercial projects, new consumer spending, and a new restaurant and bar demand. If the economy enjoys robust growth in Q3, what impacts will that have on product quality control? Architects still need a precision measurement. A car’s sensors must accurately detect oil pressure, tire pressure, and the amount of fuel left in the tank. The pub’s beer taps work only when the kegerator pressure regulator is accurate; otherwise, it’s all soapy suds – or an empty glass.
Thus, if not properly managed, the economy could experience renewed supply chain disruptions not unlike what happened when the crisis began. Instead of operating plants shutting down amid rising demand for products like hand sanitizer, N95 masks, ventilators, and, oddly, toilet paper, restarting manufacturing, potentially with new, less experienced employees, all while demand is high, risks quality control challenges all its own.
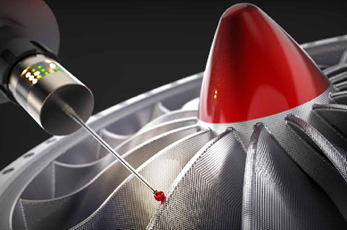
Enter metrology and the enhanced value of gage R&R. Gage R&R (repeatability and reproducibility) is a statistical analysis used by engineers and product specialists designed to improve measurement accuracy from three touchpoints: variability in the product itself, repeat accuracy of the measuring device used by the same operator and repeat accuracy of the measuring device used by a different operator. In a typical gage R&R study, three operators measure 10 parts two times. Taken in whole, this is what narrows measurement variability in both amplitude and magnitude (for any gage or precision measurement product) into acceptable ranges. Seen in this light, gage R&R isn’t some perfunctory pre-step to product production or a box to be checked off a pre-assembly to-dos list; it is the essential first step in any manufacturing process.
‘Too often, the reality is this: People avoid gage R&R because industry can too easily misinterpret the data. Without industry understanding what gage R&R means they often falsely look at the accuracy of the device performing the measurement and not the process being measured.’
But the value of gage R&R shouldn’t be that difficult to grasp. Think of it like a souped-up version of the carpenter’s adage: “Measure twice and cut once.” Only by applying these principles and investing in gage R&R will businesses across the globe ensure that their product quality control is up to par in the post-COVID-19 world – a world that is excitedly, if haltingly, approaching.
The way it works is simple. There are several methods for completing a gage R&R study. Accordingly, the two most widely accepted for calculating gage R&R include:
The Average and Range Method – According to a 2017 Statgraphics Technologies report (Parent company: Statpoint Technologies, Inc. which develops and markets Windows software for statistical analysis): “The Average and Range Method estimates the R&R of a measurement system based on a study in which m appraisers measure n items r times. It also estimates important quantities such as the total variation, the precision-to-tolerance ratio, the standard deviation of the measurement error, and the percent of study contribution from various error components.”
The ANOVA (Analysis of Variance) Method – According to BPI Consulting, LLC, (a software, training, and consulting organization), “This method uses analysis of variance to analyze the results of a gage R&R study instead of the classical average and range method. The two methods do not generate the same results, but they will (in most cases) be similar.” Sources of variation can include the process itself, sampling, or the measurement system.
The results of your gage R&R study, will, (not surprisingly) vary. But there are established ranges of acceptability confirming that what you’ve measured is accurate, both from an operator perspective and a gage readout perspective. In fact, a common misconception by inexperienced gage R&R analysts is the idea that you should have no variance whatsoever. But a gage R&R study that reveals no variance in the parts measured is flawed. Why? Because no matter what you measure and no matter how many environmental controls you account for, variability is an unavoidable state of nature.
But like any experiment, you have to control for variables you can account for, or you won’t learn a thing. Very often it’s the little things that matter most. Something as simple as not tightening the arm on the table for a portable coordinate measuring machine, for instance, can throw off results.
So when you perform a gage R&R study, provided you’ve set it up accurately, what are you looking for? Expressed in terms of a percentage, “percent tolerance” or “percent process variation” is what’s most important. Ranges that fall under 10 percent are considered acceptable. Ranges of 10 to 30 percent are marginal or acceptable for some applications. Ranges over 30 percent are unacceptable. The Automotive Industry Action Group ( AIAG), a not-for-profit organization whose work includes setting measurement standards, cites these acceptable ranges.
As the US and the world emerge from this unprecedented moment, what we don’t want to see is a flood of products that flirt with the upper range of acceptable variance and into unacceptable. Exuberance to reopen is good. Prudence in doing so, however, just like the phased reopening of any country from a social distancing perspective, is equally important. That’s true whether the economy experiences U-curve or V-curve growth, depending on the model.
From a manufacturing perspective, no matter the industry, whenever you take a process dry from completely shuttered to open again, or from low-speed to high-speed ramp up, quality control and/or production challenges are often inevitable. Before successful ramp-up can occur a lead team of engineers is essential in reviewing the pre-launch process.
En’GAGE’d in Your Success
But regardless of the amplitude of the eventual economic turnaround, it’s clear gage R&R will remain a vital if the unspoken hero of the metrology industry and the industries that rely on that reproducible and repeatable accuracy.
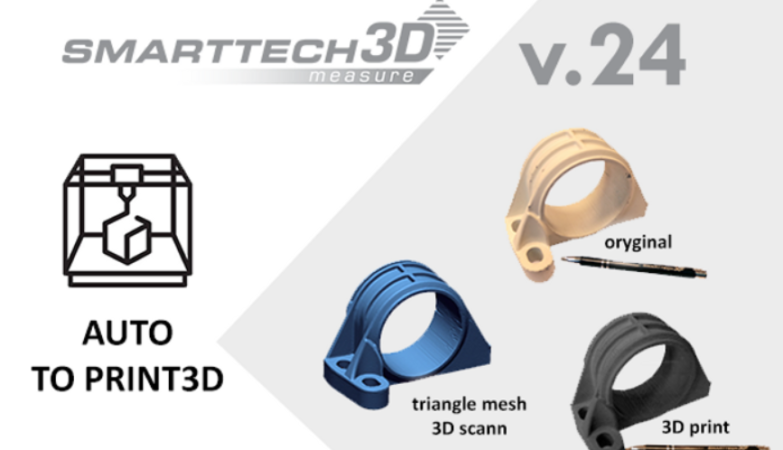
That’s true even as gage R&R continues to push the boundaries of what’s possible in precision measurement with advances in non-contact point cloud data acquisition, a technology of which many in Metrology understand will require new gage R&R. Ensuring that accuracy means a steadfast commitment to the highest standards of gage R&R.
For the metrology industry, the results are clear: faster, more accurate, and actionable 3D documentation, accelerated execution and measurement times, minimized scrap and rework costs, and reduced product development risk.
With a little luck, in a matter of months talk of flattened curves will be history. The world will have moved on to something resembling normal. But from this author’s perspective at least, it seems that as America and the world begins to reopen for business, economists and epidemiologists could learn a lot from metrologists and apply the logical underpinnings of gage R&R studies to their work.
Otherwise, it’s just noise.
To know more, check FARO.